Before you go...
We built a free scorecard that shows how your heat pump, ventilation and solar systems are performing. Results are usually surprising.
Get my score
No thanks
We built a free scorecard that shows how your heat pump, ventilation and solar systems are performing. Results are usually surprising.
No thanksWe built a free scorecard that shows how your heat pump, ventilation and solar systems are performing. Results are usually surprising.
No thanks
Solar panels can lose output for months without triggering any obvious alert. The two signs most Auckland homeowners notice first are monitoring app figures that look lower than expected on a clear day, and power bills that are higher than they should be without an obvious reason.
Output loss doesn't look like a problem. It looks like a slightly higher bill, or generation figures that seem a bit low on a sunny day.
Your inverter records how much power your system produced. It doesn't record how much it should have produced given the conditions that day.
That matters because output loss from dirty or degraded panels is slow and cumulative. It doesn't trigger an alert. It sits inside normal daily and seasonal variation until you compare current figures against historical data from when the panels were clean. Most systems lose output steadily across months or years without a single reading that looks obviously wrong.
Real owners describe this as output that "struggles to hit peak like it used to" or generation that looks "sub-optimal even on a sunny day." The monitoring app still shows numbers. The system still appears to be working. The shortfall is real, but nothing flags it.
The most reliable check available to any homeowner is a year-on-year comparison for the same month. If your system produced noticeably less this June than last June and the weather pattern was similar, that gap is worth investigating. For a full explanation of why gradual loss stays invisible in the monitoring data, see how dirty solar panels affect your output.
A visual check using your phone camera on zoom will reveal more than most owners expect. You don't need roof access to spot the early signs.
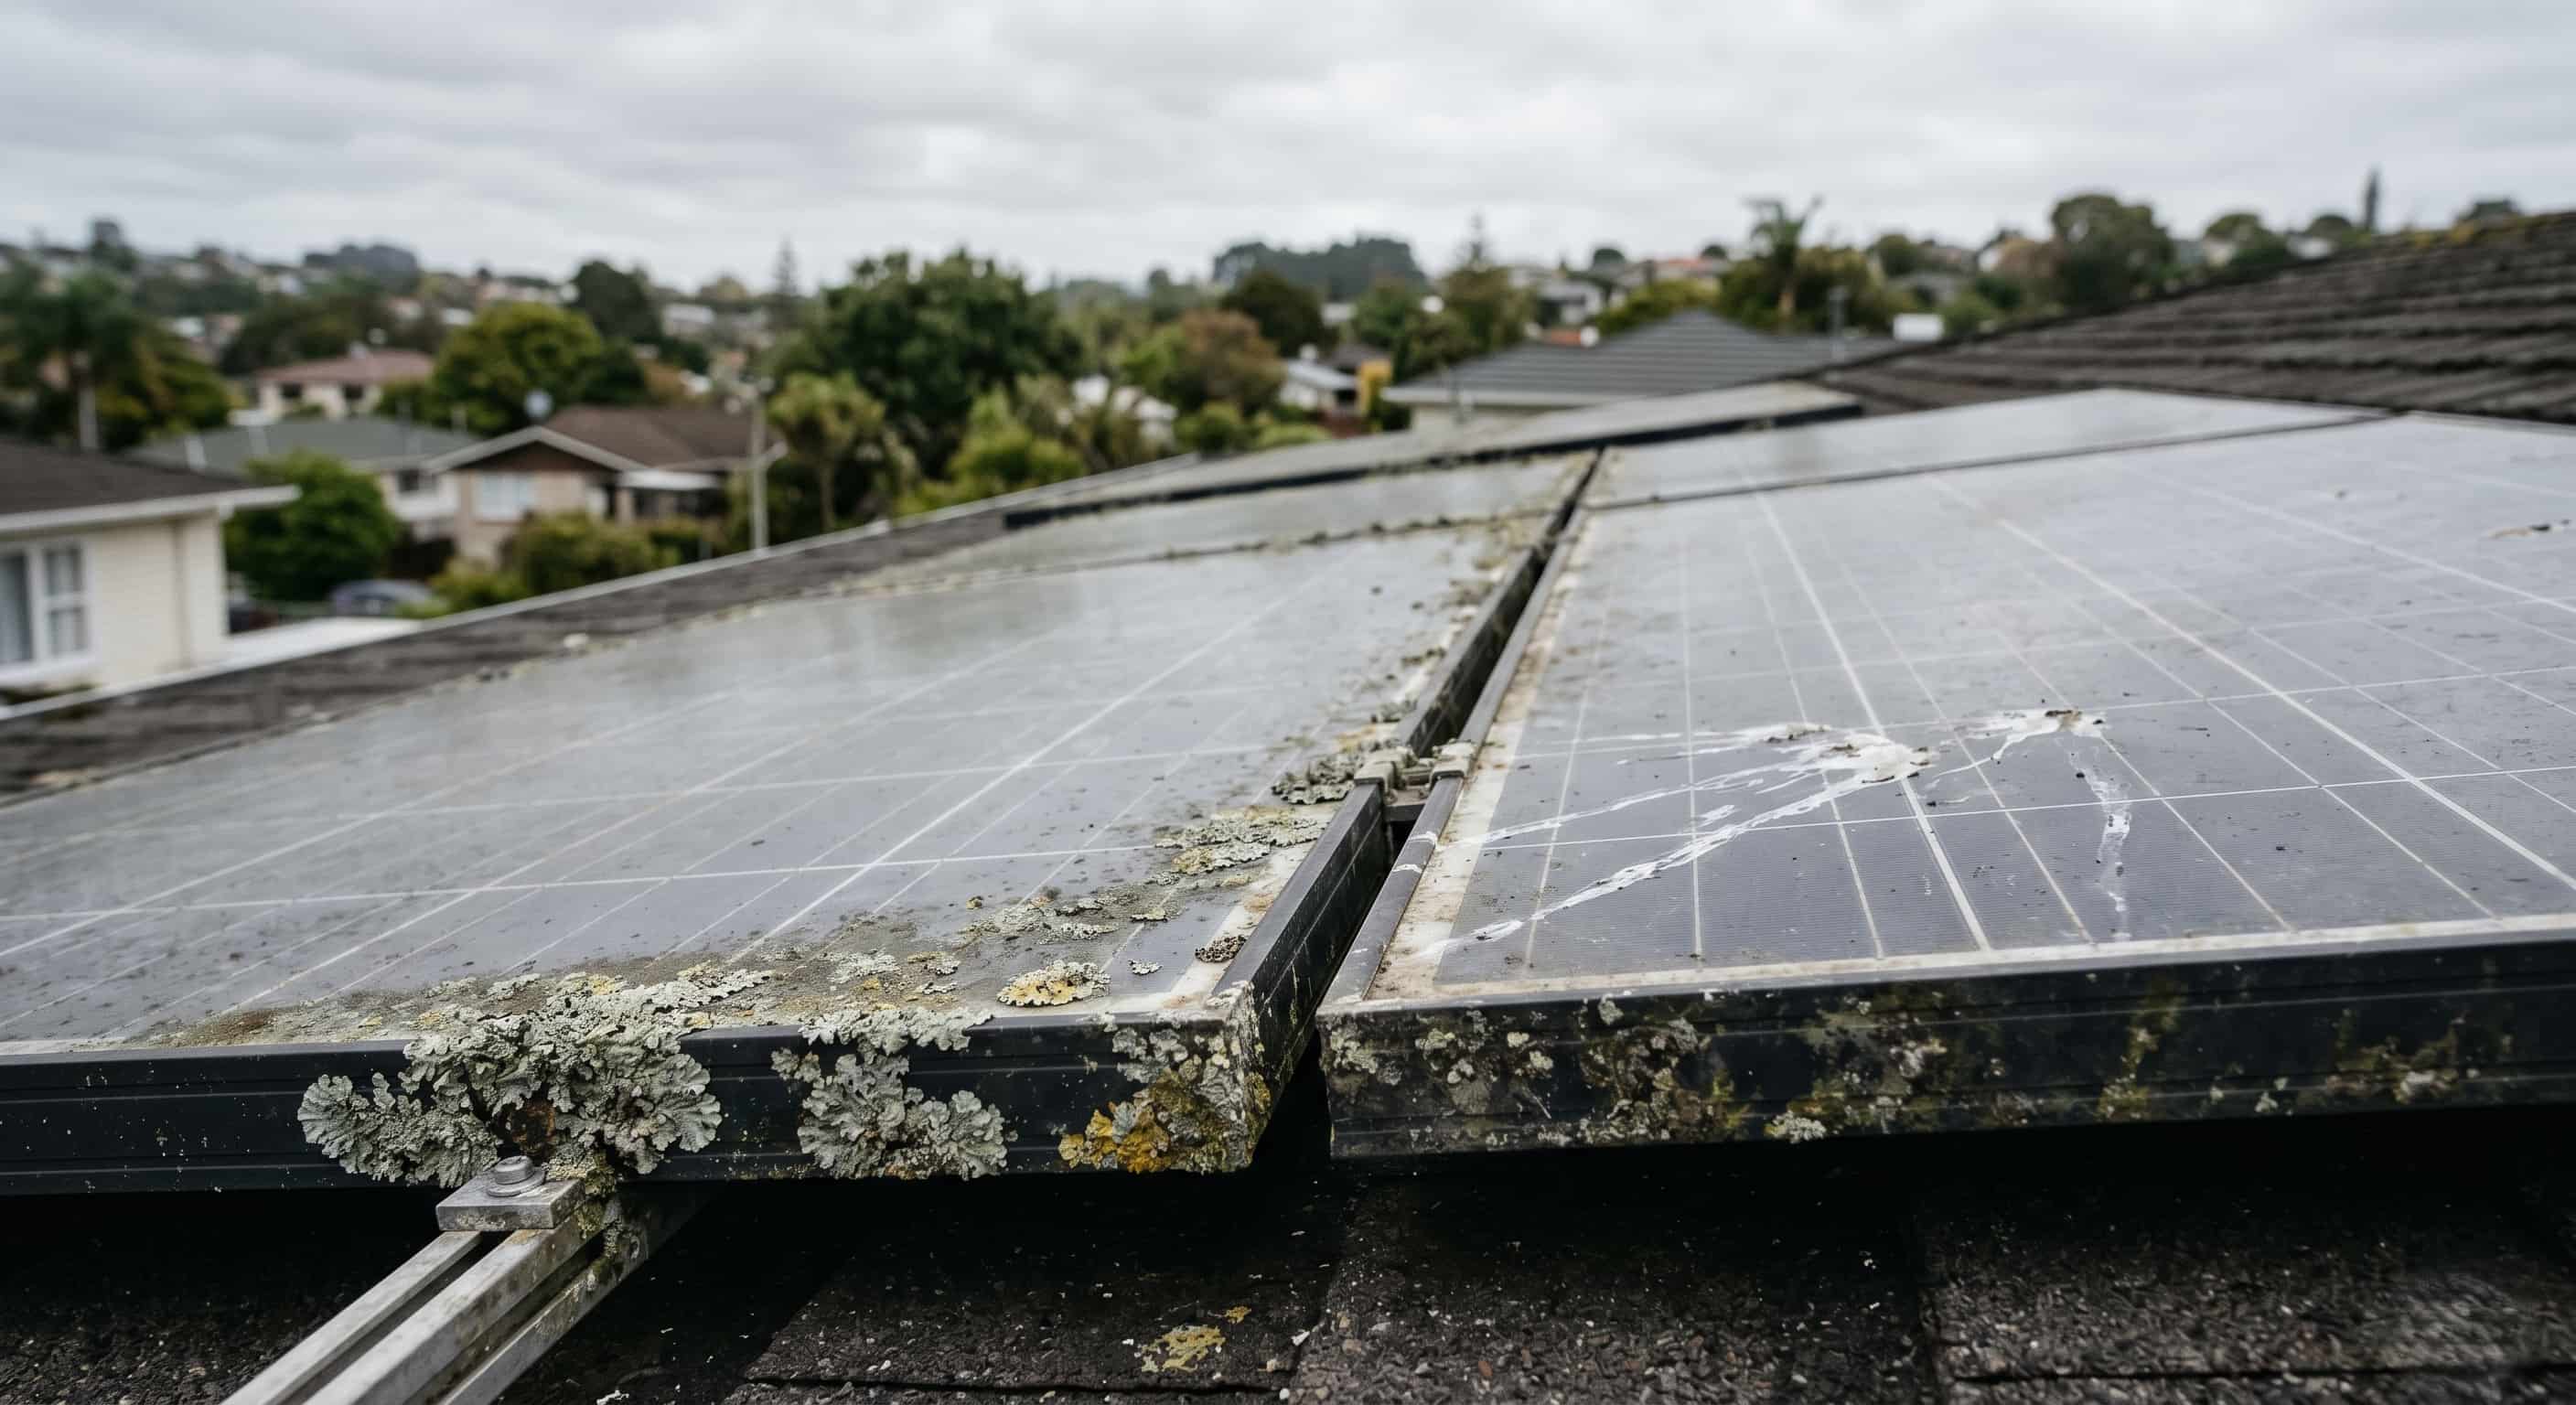
A grey cast or film across the panel surface means rain hasn't been clearing the accumulation. In Auckland's climate that's typically a mix of airborne grime and early biological growth, not simple dust. It won't clear after a wet week.
White streaking is almost always bird droppings. Dark or greenish patches at the panel edges or across the glass are lichen establishing. Both cause concentrated shading over individual cells rather than even output loss across the whole panel. A deposit that looks minor from the ground can be sitting directly over the cells carrying the most generation load for that panel.
Lichen tends to start at the margin where the frame meets the glass, particularly on west-facing panels. If there's visible growth in those margins, it has usually spread further across the surface than the edges alone suggest.
New shade is worth checking too. Trees grow. Neighbouring structures go up. An obstruction that didn't exist at installation may now be casting shade across one or more panels for part of each day. Output that drops at the same time each day, rather than across the full day, points to a shading change rather than soiling.
By the way — we built a free scorecard that shows how your heat pump, ventilation and solar are performing. Results are usually surprising.
A higher than expected power bill during a month with reasonable weather is one of the more reliable signals that something has changed in the system.
Most people attribute it to the season, electricity prices, or general household usage. One NZ owner described having $400 power bills through winter despite a 30-panel system and generating next to nothing back to the grid. Eight months that felt like teething issues turned out to be a wiring fault present since installation.
This is the Set and Forget Cost in practice. The system appears to be running. Nothing looks obviously wrong. But the gap between what the system is producing and what it should be producing is adding up on every bill. A single high bill isn't a signal on its own. A pattern across several months, particularly if the system hasn't been assessed recently, is worth taking seriously.
A professional solar assessment starts with the inspection, before anything is touched. A trained technician checks the panels for physical damage including cracks, discolouration, and delamination. Frames and mounting hardware are checked for corrosion and loose fastenings. Roof penetration seals are assessed. Cabling is checked for UV degradation and secure attachment. Isolators and junction boxes receive a visual condition check.
Inverter output is recorded before the visit starts. After any cleaning is completed, it's recorded again. The difference between those two readings is the objective measure of whether contamination was affecting generation. That before and after reading is where the Untapped Power in your system becomes visible: the generation the panels were already capable of, now recovered.
The visit closes with a written condition report covering what was found, what was done, and anything identified outside the scope of cleaning. Where lichen is found at moderate or heavy severity, the condition report will include a recommendation for a specialist remediation visit; this would normally be a separate service from a standard clean as it uses different products and methods. For a full explanation of what that growth is doing to your panels and why it needs specialist treatment, see lichen, moss, and biological growth on solar panels. A corroding mount, damaged cabling, or an inverter anomaly gets documented clearly and referred to a qualified specialist rather than guessed at or ignored.
This is what separates a proper assessment from a wash. The inspection addresses the condition of the system. The clean addresses what's on the panels. The condition report makes the outcome measurable. All three matter.
For a full breakdown of what a professional visit covers, see what a professional solar panel cleaning service in NZ includes and solar panel cleaning services: what's involved and what it costs.
Real owner reports from NZ forums show a consistent pattern. Panels go 18 months to two years without attention, owners assume the rain is managing it, and the next professional visit finds established lichen or contamination building since installation.
One NZ owner noted their panels had been on the roof for 18 months and were clearly getting dirty despite regular rain. Another cleaned theirs after nearly two years and found significant buildup. A third had a system quietly underperforming for over six months before anyone looked at it.
Every one to two years is a reasonable starting point for most Auckland installations. That interval is shorter for flat or low-pitch roofs, coastal properties within around a kilometre of the ocean, properties with significant bird activity, and west-facing arrays where lichen accumulates faster. Any system not assessed since installation should be treated as a priority regardless of how long ago it was installed. For a full picture of what typically builds up on a never-serviced system and what a first professional visit finds, see solar panels that have never been professionally serviced.
For guidance on building the right schedule for your specific situation, see solar panel maintenance in NZ: how to build the right plan.
By the way — we built a free scorecard that shows how your heat pump, ventilation and solar are performing. Results are usually surprising.
Compare your monitoring app output for the same month year on year. If this October produced noticeably less than last October and the weather was similar, the panels are worth checking. Visible lichen, bird droppings, or a grey film on the surface are physical signs that output is being affected. A power bill consistently higher than expected during months with reasonable weather is a secondary indicator worth investigating.
Your monitoring app records what was produced, not what should have been produced. If visible lichen or droppings are present, specific cells are already shaded and generating less than they should. The app has no reference point for what the system could be producing under current conditions, so it reports the reduced output without flagging it. The gap only becomes visible when you compare against a clean baseline or the same period in a previous year.
In most cases, soiling causes output loss rather than irreversible damage. Lichen bonds to the anti-reflective coating on panel glass and becomes progressively harder to remove the longer it establishes. Hotspots caused by concentrated shading over individual cells from bird droppings or lichen can cause permanent cell damage if left unaddressed for an extended period. Acting on visible contamination before it bonds is simpler and less costly than treating it once it has established.
Several things reduce output without visible soiling. New shade from tree growth or a neighbouring structure reduces generation from affected panels consistently. Physical damage to panel glass or cabling not visible from the ground can also be a factor. A professional assessment with before and after inverter readings is the most reliable way to identify which category the issue falls into.
Every one to two years is a reasonable starting point for most Auckland installations. That interval shortens for flat or low-pitch roofs, coastal properties, properties with significant bird activity, and west-facing arrays where lichen accumulates faster. Any system not assessed since installation should be prioritised regardless of how long ago it was installed or how the panels appear from the ground.